Existing Power Plants

As at 31 December 2024, the Group’s total consolidated installed capacity was 49,390.9MW, of which consolidated installed capacity of clean energy was 39,570.9MW, accounting for 80.12% of the total consolidated installed capacity. While the Group’s total consolidated installed capacity presented by type of power plants is as follows:
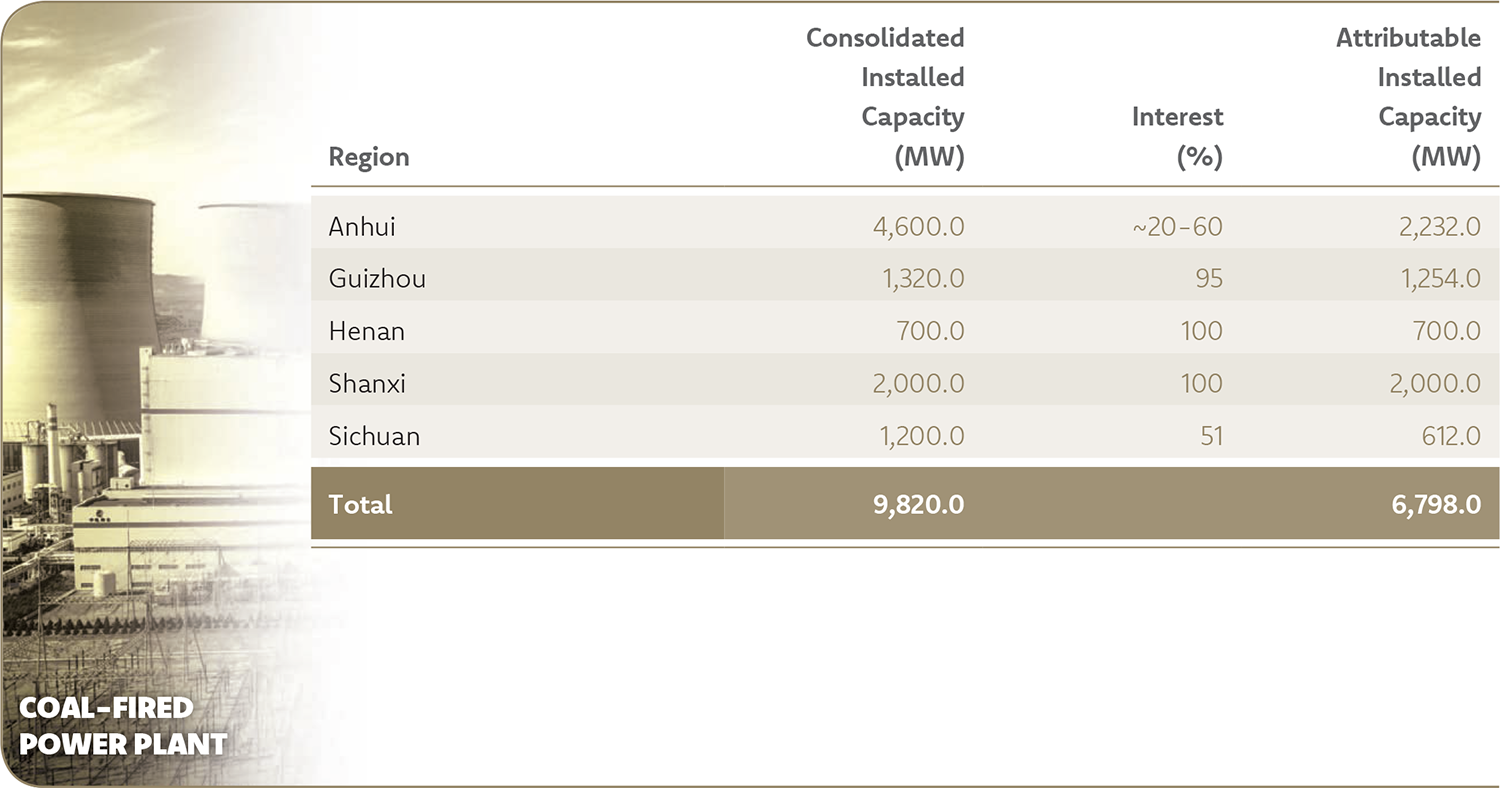
Type of Power Plants Installed Capacity (MW) Interest (%) Attributable Installed Capacity (MW) Consolidated Installed Capacity (MW)
Hydropower 6,349.0 ~9.13-64.93 3,842.6 6,001.1
Wind Power 17,981.1 ~8.02-100 8,583.0 14,127.0
Photovoltaic Power 24,123.1 ~9.5-100 13,220.1 18,620.5
Natural Gas Power 4,353.3 ~12.9-100 986.3 505.3
Environmental Power 317.0 ~51-100 256.0 317.0
Coal-fired Power 32,744.5 ~9.5-100 12,829.1 9,820.0
Total 85,868.0 39,717.7 49,390.9

As at 31 December 2024, the total consolidated installed capacity of the Group’s wholly-owned and controlled power plants presented by region is as follows:
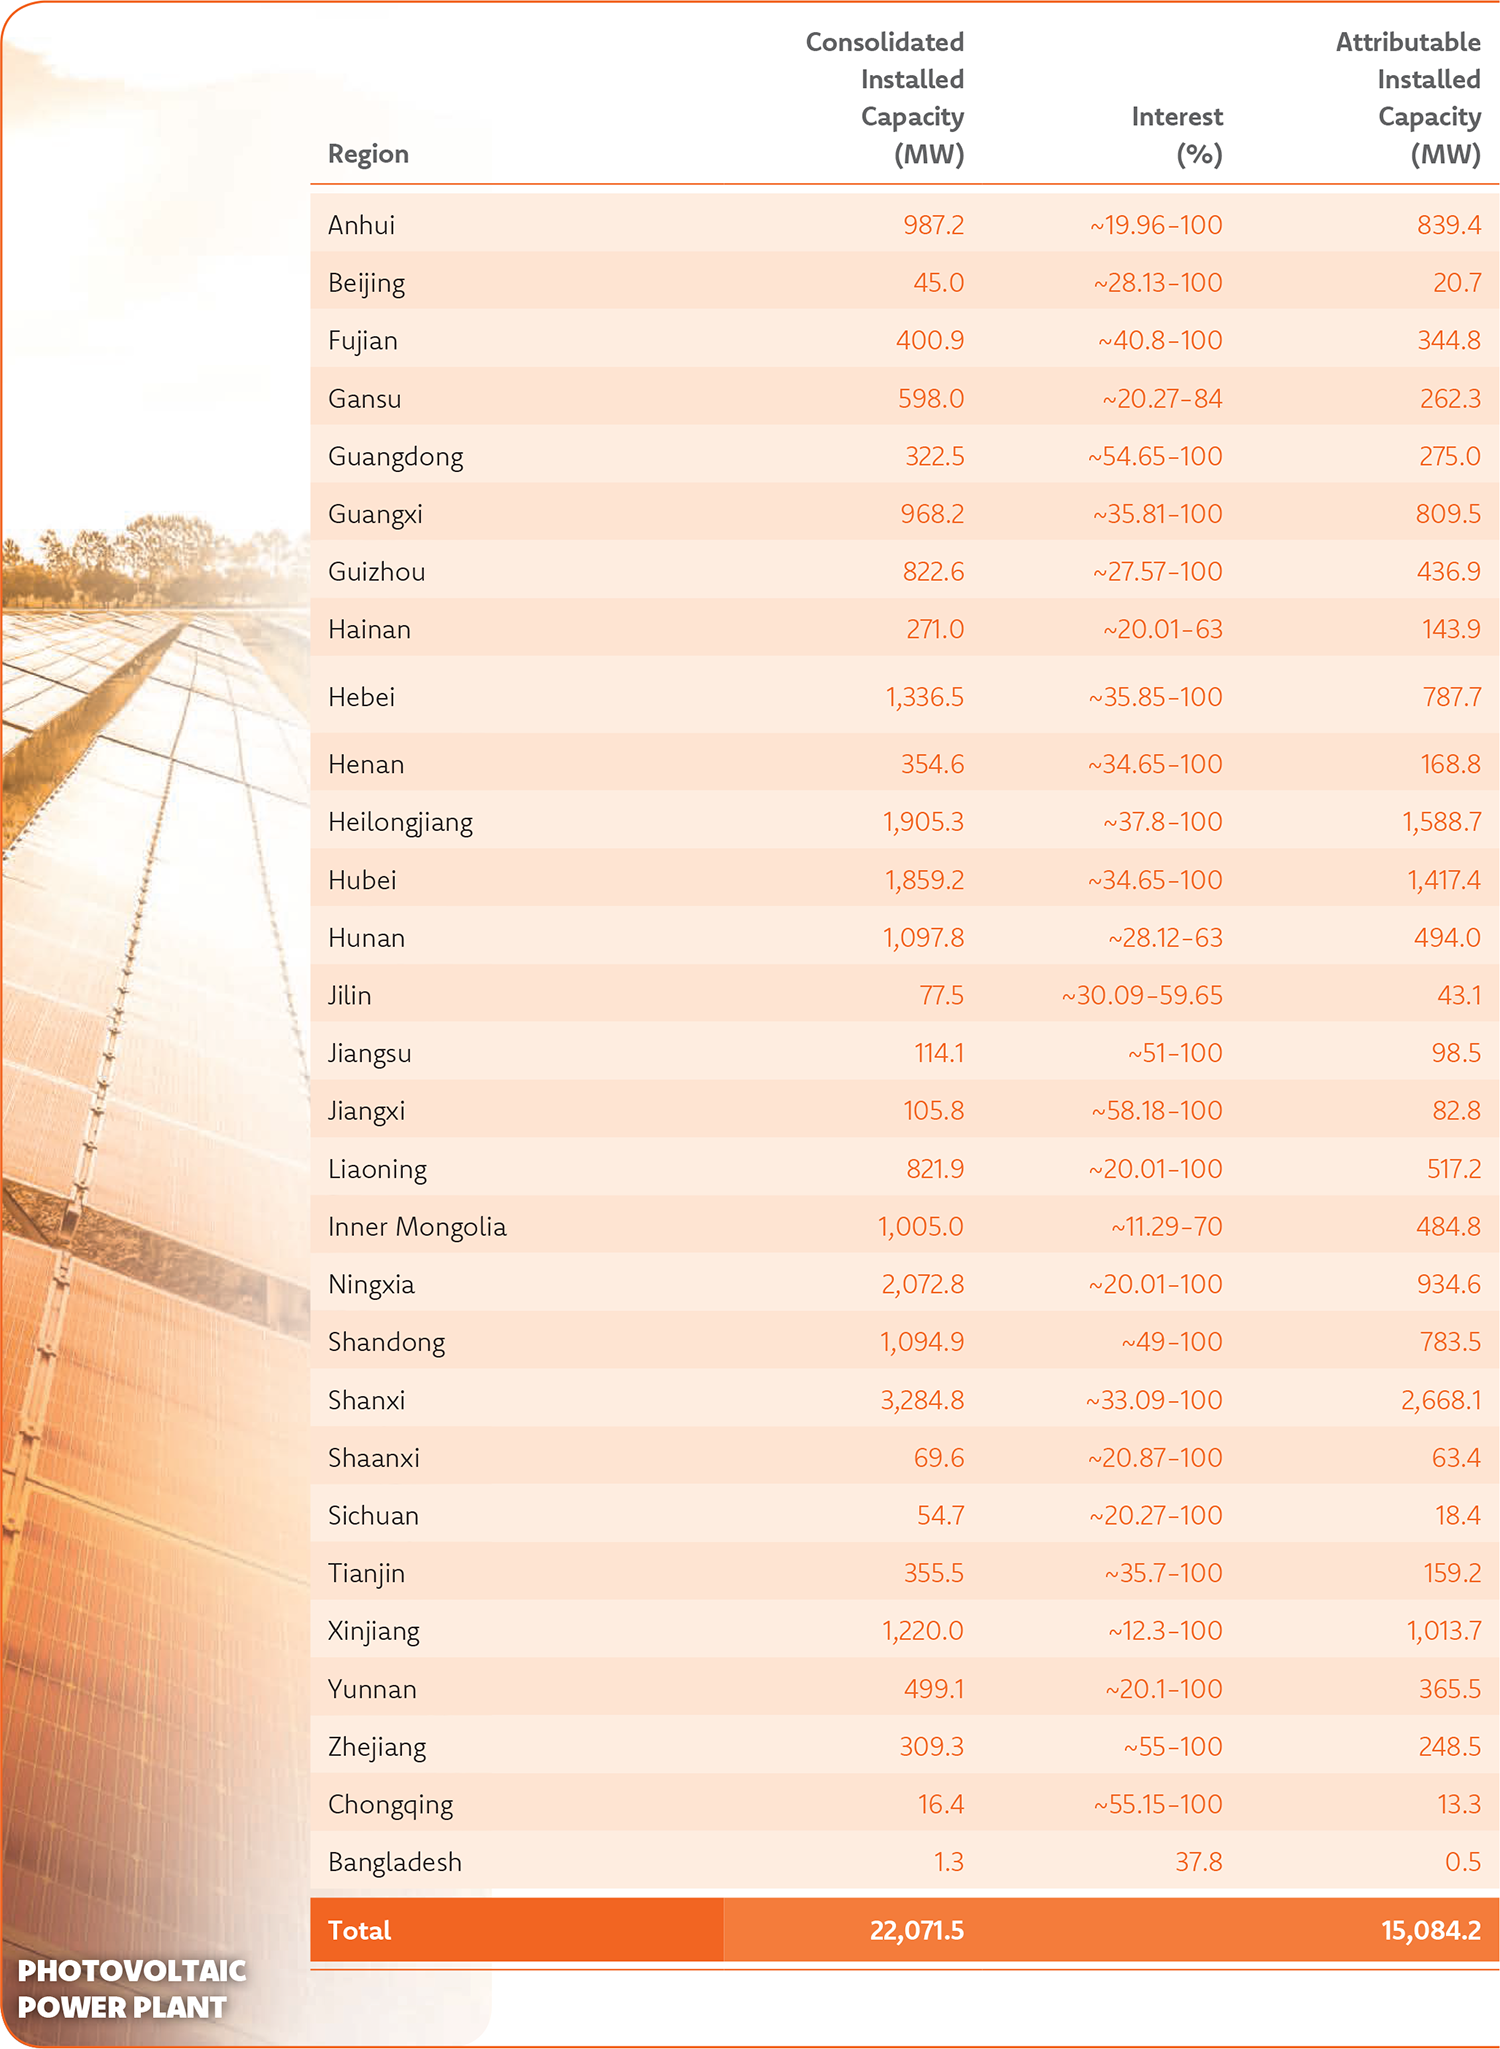
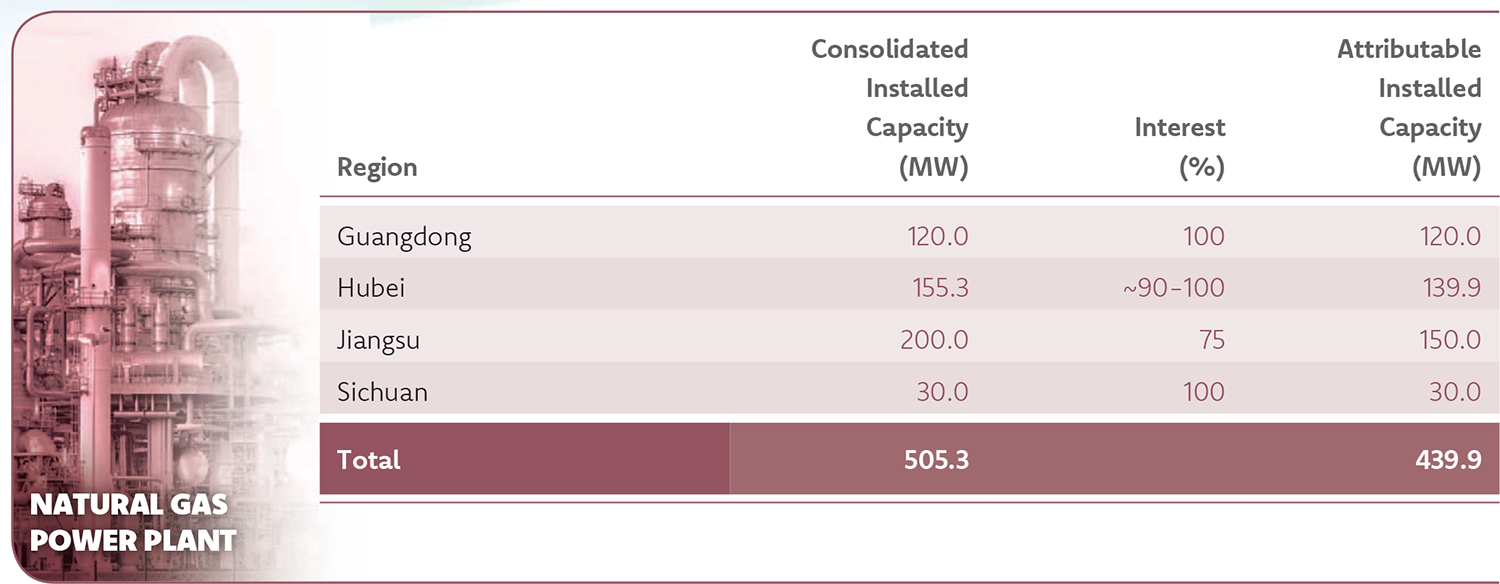
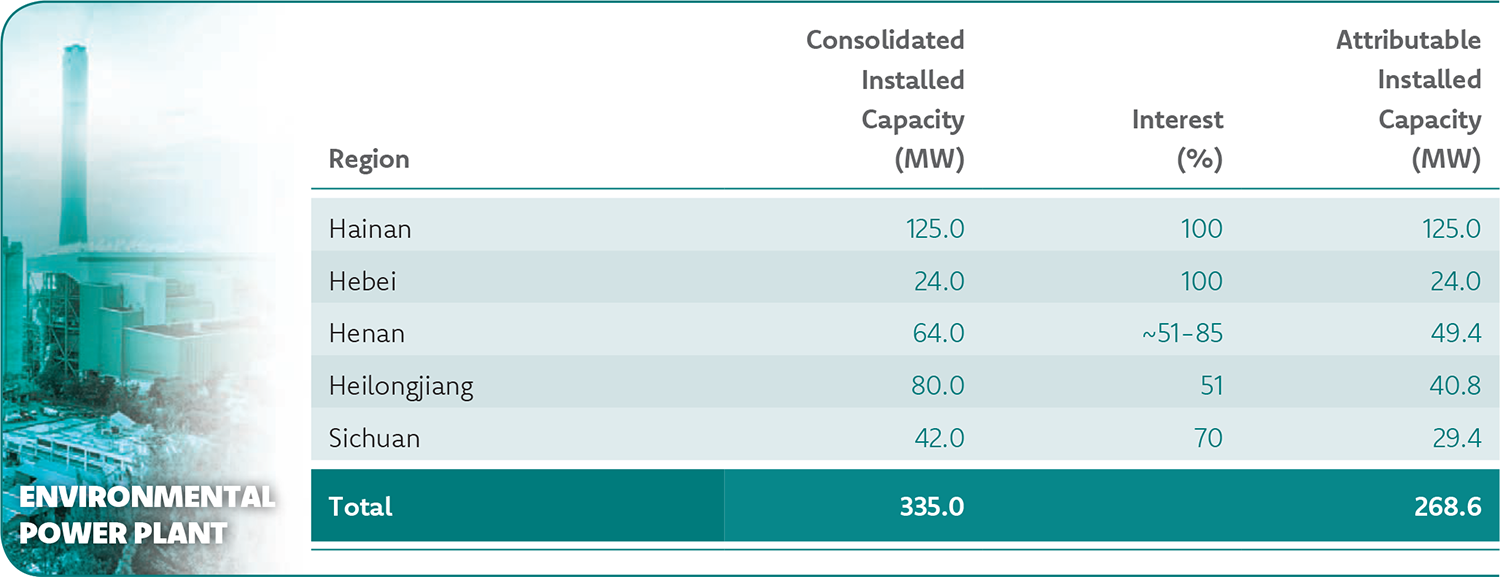
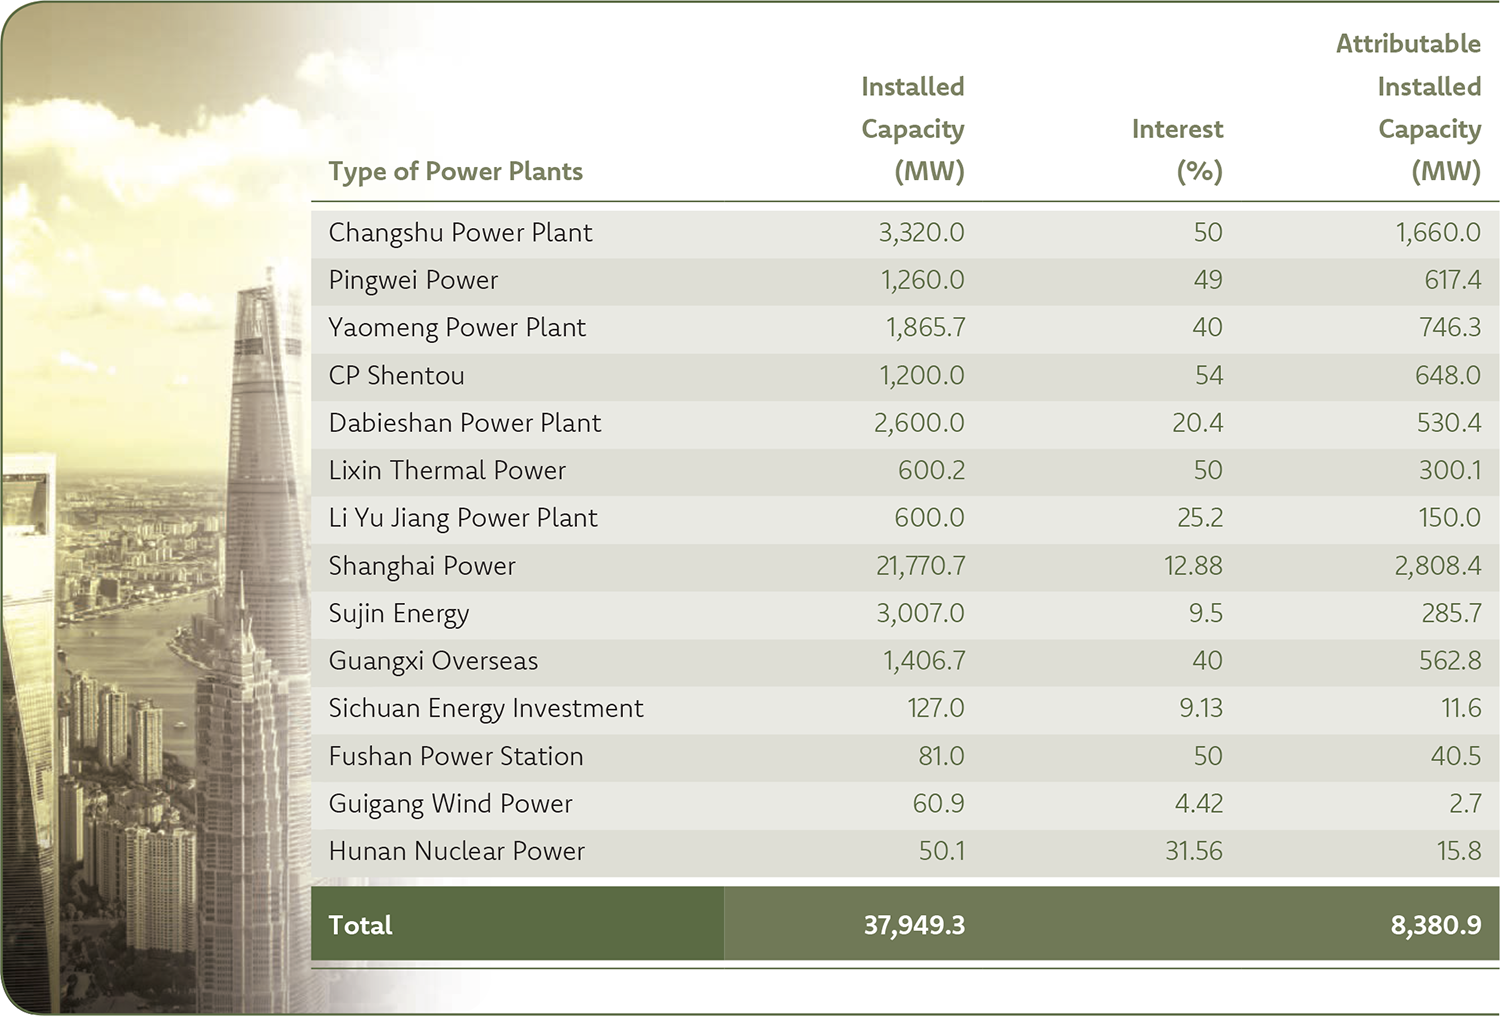
Hydropower Power Plant

Region Consolidated Installed Capacity (MW) Interest (%) Attributable Installed Capacity (MW)
Hunan 3,659.7 63 2,305.7
Guizhou 1,570.0 59.85 939.7
Guangxi 630.0 64.93 409.1
Sichuan 141.4 ~57.33-63 88.1
Total 6,001.1 3,742.6

Wind Power Plant

Region Consolidated Installed Capacity (MW) Interest (%) Attributable Installed Capacity (MW)
Shandong 2,929.9 ~11.29-100 1,554.8
Shanxi 1,773.6 ~20.09-100 946.1
Hunan 1,488.3 ~15.15-55.15 565.2
Guangxi 1,334.4 ~18.98-100 916.1
Gansu 1,270.5 ~20.26-100 849.1
Inner Mongolia 1,106.1 ~13.05-100 422.0
Henan 912.1 ~32.74-100 824.9
Guangdong 511.5 ~32.13-100 389.9
Hubei 507.6 ~20-100 365.3
Xinjiang 495.0 ~13.05-41.63 136.2
Jiangsu 401.7 ~20-70 133.0
Ningxia 326.5 ~20.09-49.64 114.3
Liaoning 299.5 ~38.72-54.56 155.6
Heilongjiang 264.8 ~20.1-100 225.2
Shaanxi 149.0 ~51-100 100.5
Anhui 99.5 ~32.13-35 33.4
Yunnan 97.5 ~32.13-44.1 37.1
Qinghai 50.0 100 50.0
Jilin 49.5 35 17.3
Bangladesh 60.0 34.02 20.4
Total 14,127.0 7,856.4

Photovoltaic Power Station

Region Consolidated Installed Capacity (MW) Interest (%) Attributable Installed Capacity (MW)
Shanxi 2,775.8 ~33.09-100 1,824.8
Ningxia 2,072.8 ~20.01-100 890.5
Hubei 1,799.2 ~34.65-100 1,372
Heilongjiang 1,782.3 ~37.8-100 1,494.3
Hebei 1,326.5 ~35.85-100 775.9
Inner Mongolia 1,016.4 ~15.15-70 504.9
Anhui 947.8 ~20-100 834.7
Guangxi 914.2 ~36.36-100 775.6
Xinjiang 870.0 ~13.05-100 663.8
Shandong 855.8 ~49-100 652.1
Liaoning 816.9 ~20.01-100 512.2
Yunnan 407.8 ~20.01-100 280.3
Fujian 372.0 ~40.8-100 319.7
Hunan 362.8 ~32.13-100 189.7
Henan 352.0 ~34.65-100 167.3
Tianjin 333.6 ~35.7-100 147.7
Guizhou 306.4 ~32.32-100 172.8
Zhejiang 301.1 ~55-100 240.3
Gansu 298.0 ~20.26-73.30 91.1
Guangdong 257.8 ~54.65-100 221.1
Jiangxi 102.8 ~58.18-100 79.8
Jiangsu 101.8 ~45-100 86.4
Jilin 77.5 ~30.09-59.65 43.1
Shaanxi 52.5 100 52.5
Hainan 37.7 ~20.01-63 15.2
Beijing 34.3 ~28.13-100 16.2
Sichuan 34.3 20.26 6.9
Chongqing 10.4 ~55.15-100 7.3
Total 18,620.50 12,438.20

Natural Gas Power Plant

Region Consolidated Installed Capacity (MW) Interest (%) Attributable Installed Capacity (MW)
Jiangsu 200.0 100 200.0
Hubei 155.3 ~90-100 139.9
Guangdong 120.0 100 120.0
Sichuan 30.0 100 30.0
Total 505.3 489.9

Environmental Power Plant

Region Consolidated Installed Capacity (MW) Interest (%) Attributable Installed Capacity (MW)
Hainan 125.0 100 125.0
Heilongjiang 80.0 51 40.8
Henan 64.0 ~51-85 49.4
Hebei 24.0 100 24.0
Sichuan 24.0 70 16.8
Total 317.0 256.0

Coal-fired Power Plant

Region Consolidated Installed Capacity (MW) Interest (%) Attributable Installed Capacity (MW)
Anhui 4,600.0 ~20-60 2,232.0
Shanxi 2,000.0 100 2,000.0
Guizhou 1,320.0 95 1,254.0
Sichuan 1,200.0 51 612.0
Henan 700.0 100 700.0
Total 9,820.0 6,798.0

As at 31 December 2024, the total attributable installed capacity of the Group’s main associates, joint ventures and investment holding companies’ power plants are as follows:
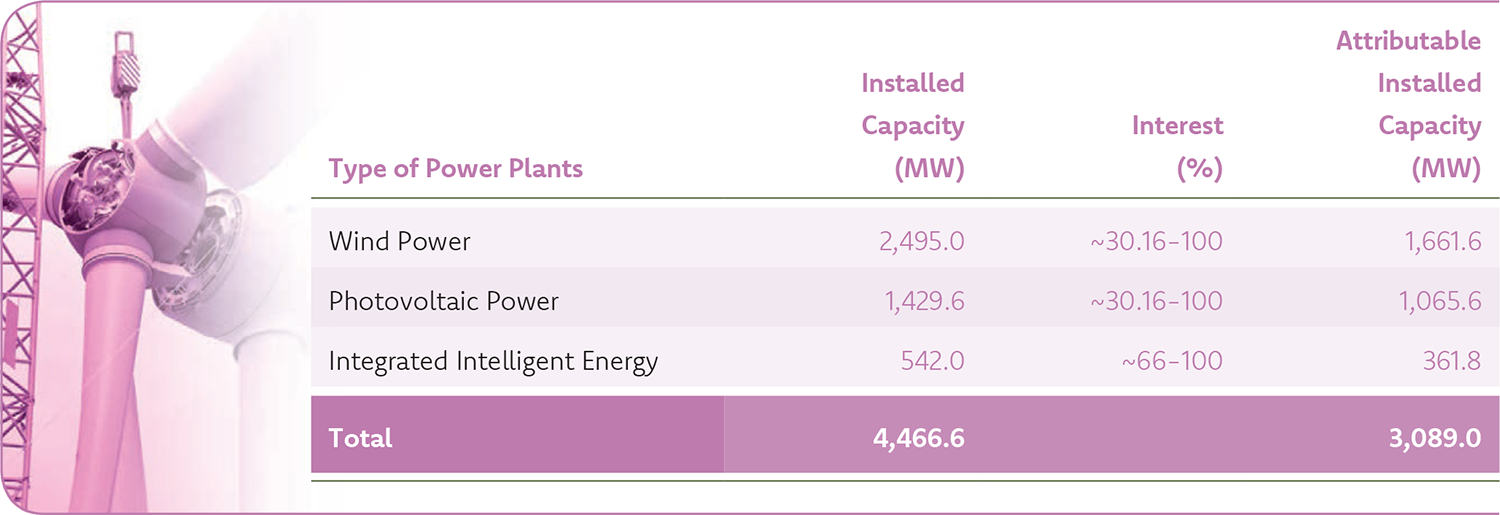
Power Plants
Region Installed Capacity (MW) Interest (%) Attributable Installed Capacity (MW)
Shanghai Power 20,413.9 12.9 2,633.4
Changshu Power Plant 3,320.0 50 1,660.0
Yaomeng Power Plant 1,865.7 40 746.3
CP Shentou 1,200.0 54 648.0
Pingwei Power 1,260.0 49 617.4
Dabieshan Power Plant 2,600.0 20.4 530.4
Guangxi Overseas 1,231.4 40 492.6
Lixin Thermal Power 600.0 50 300.0
Sujin Energy 3,007.0 9.5 285.7
Li Yu Jiang Power Plant 600.0 25.2 151.2
Fushan Power Station 81.0 50 40.5
Hunan Nuclear Power 110.0 12.6 13.9
Sichuan Energy Investment 127.0 9.13 11.6
Guigang Wind Power 60.9 8.02 4.9
Total 36,477.1 8,136.0

Projects Under Construction

As at 31 December 2024, the Group’s projects under construction presented by type of power plants is as follows:

Type of Power Plants Installed Capacity (MW) Interest (%) Attributable Installed Capacity (MW)
Photovoltaic Power 4,609.9 ~29.93-100 3,001.3
Wind Power 1,716.5 ~33.09-100 1,274.4
Integrated Intelligent Energy 90.6 ~51-100 88.7
Environmental Power 12.0 100 12.0
Total 6,429.0 4,376.4
 

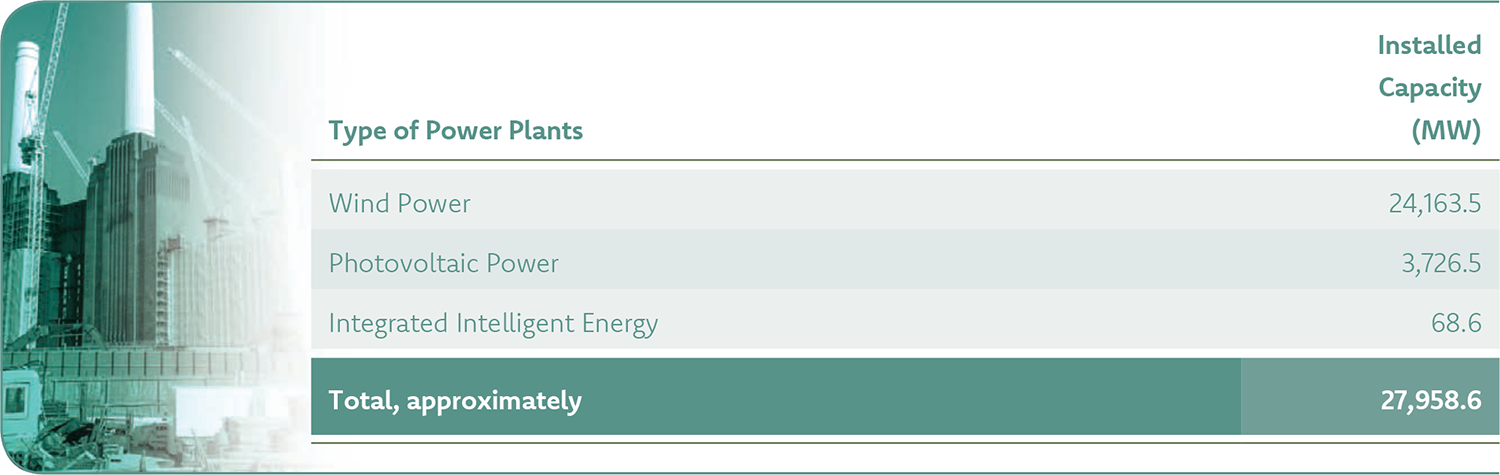
New Development Projects

As at the date of this annual report, the total installed capacity of new projects in a preliminary development stage (including projects which approvals from the government of the PRC have been applied for) is approximately 25,562.9MW. The categories are distributed as follows:
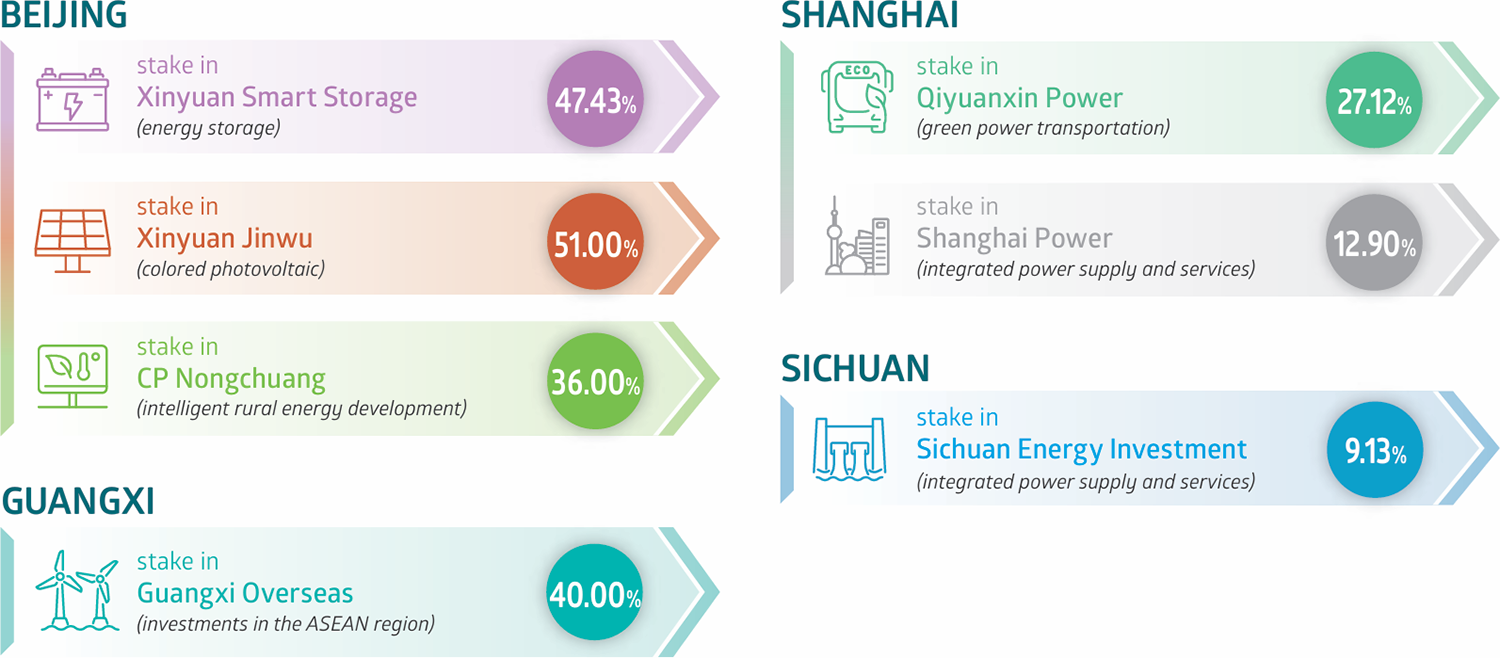
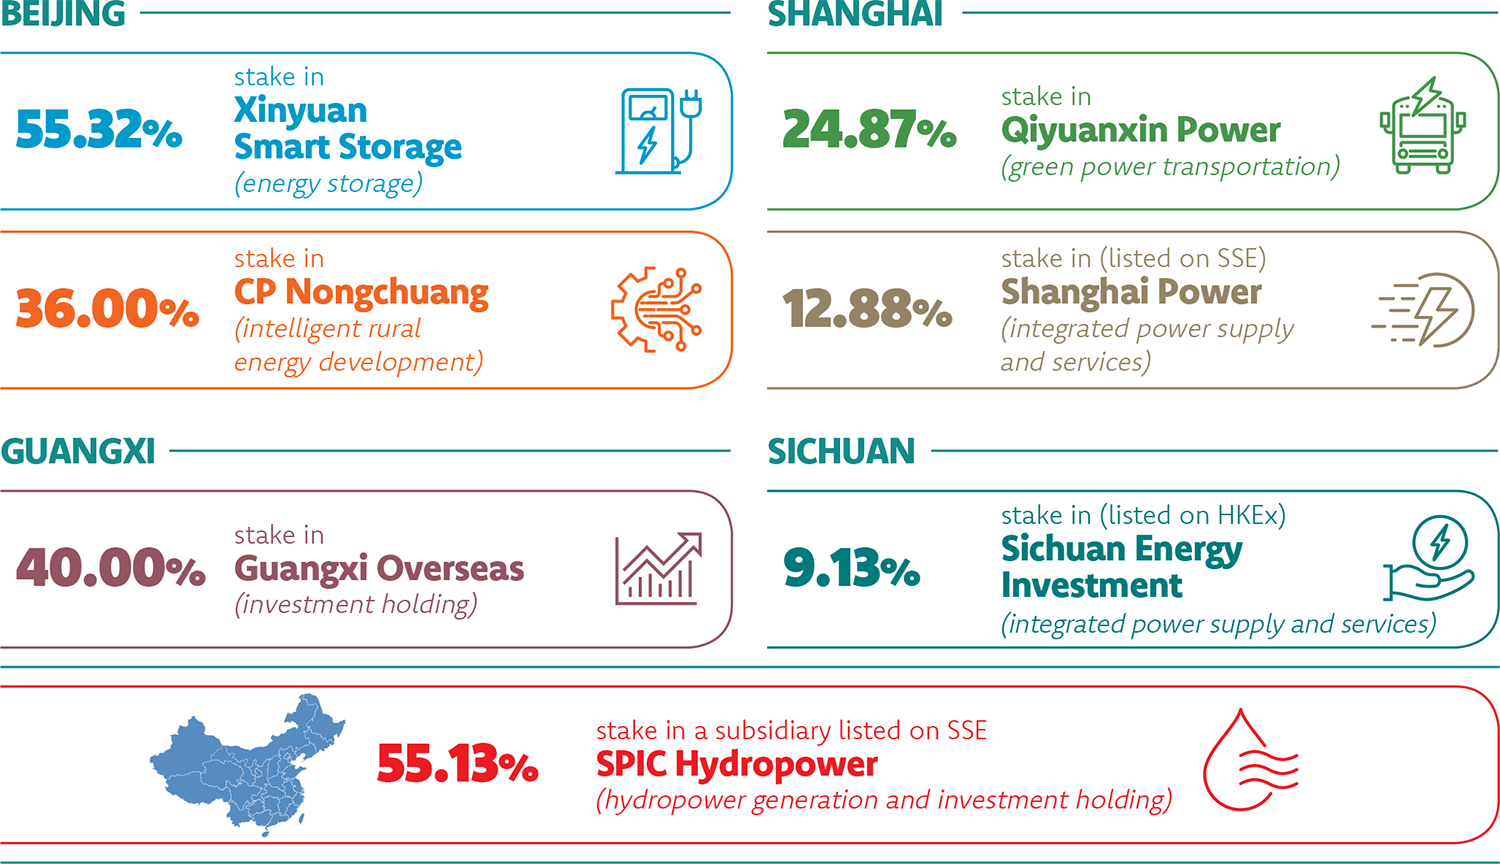
Type of Projects Installed Capacity (MW)
Wind Power 17,857.8
Photovoltaic Power 6,710.7
Integrated Intelligent Energy and Others 994.4
Total, approximately 25,562.9

Shareholding in Emerging Energy Industries and Investment Holding Companies


Ultimate Controlling Shareholder - SPIC

The Company is ultimately owned by SPIC, a wholly State-owned enterprise established by the approval of the State Council of the PRC. With the further comprehensive deepening of reform as the driving force and the development of new quality productive forces as an important focus, SPIC is fully implementing the “balanced growth strategy” and strives to be a world-class clean energy enterprise with global competitiveness. The total installed capacity is approximately 260GW, of which clean energy accounts for 72.71%.